Abstract
Examined the business request from a sales manager from AdventureWorks to generate an executive sales report of the company’s internet sales. Identify the necessary data source from the company’s data warehouse on Microsoft SQL Server, then clean/extract data through SQL queries. Import extracted data into Power BI to create interactive dashboards through Power BI that effectively communicate business insights that was specified from the sales manager.
Key Skills: Microsoft SQL Server, SQL, Power BI, Business Analytics
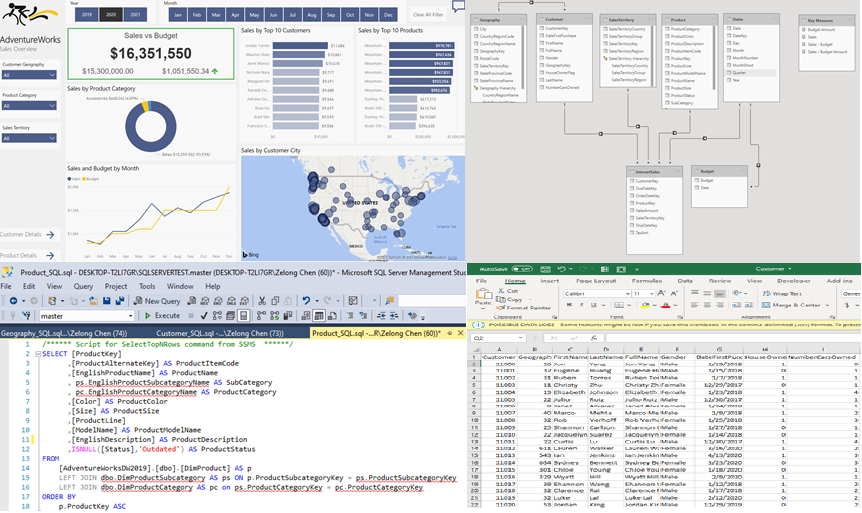
Snapshot:
Business Request
Sales Manager:
I hope you are doing well. We need to improve our internet sales reports and want to move from static reports to visual dashboards. Essentially, we want to focus it on how much we have sold of what products, to which clients and how it has been over time. Seeing as each sales person works on different products and customers it would be beneficial to be able to filter them also. We measure our numbers against budget so I added that in a spreadsheet so we can compare our values against performance. The budget is for 2021 and we usually look 2 years back in time when we do analysis of sales. Let me know if you need anything else!
- Dashboard on Internet Sales
- Filter by Products and Customers over Time
- Comparison between Sales and Budget
- Most recent 2 years
Data Cleaning and Extraction (SQL)
Tables Required:
- Internet Sales
- Sales Territory
- Dates
- Products
- Category and Subcategory
- Customer
- Geography
Internet Sales
SELECT [productkey],
       [orderdatekey],
       [duedatekey],
       [shipdatekey],
       [customerkey],
       [salesterritorykey],
       [salesamount],
       [taxamt]
FROM   [AdventureWorksDW2019].[dbo].[factinternetsales]
WHERE  LEFT(orderdatekey, 4) >= Year(Getdate()) - 2 -- Obtain only most recent 2 years
ORDER BY orderdatekey ASC;
Sales Territory
SELECT [salesterritorykey],
       [salesterritoryregion],
       [salesterritorycountry],
       [salesterritorygroup]
FROM   [AdventureWorksDW2019].[dbo].[dimsalesterritory]
Dates
SELECT [datekey],
       [fulldatealternatekey]      AS Date,
       [englishdaynameofweek]      AS Day,
       [englishmonthname]          AS Month,
       LEFT([englishmonthname], 3) AS MonthShort,
       [monthnumberofyear]         AS MonthNumber,
       [calendarquarter]           AS Quarter,
       [calendaryear]              AS Year
FROM   [AdventureWorksDW2019].[dbo].[dimdate]
WHERE  calendaryear >= 2019
Products
SELECT [productkey],
       [productalternatekey]            AS ProductItemCode,
       [englishproductname]             AS ProductName,
       ps.englishproductsubcategoryname AS SubCategory,
       pc.englishproductcategoryname    AS ProductCategory,
       [color]                          AS ProductColor,
       [size]                           AS ProductSize,
       [productline],
       [modelname]                      AS ProductModelName,
       [englishdescription]             AS ProductDescription,
       Isnull([status], 'Outdated')     AS ProductStatus
FROM   [AdventureWorksDW2019].[dbo].[dimproduct] AS p
       LEFT JOIN dbo.dimproductsubcategory AS ps
              ON p.productsubcategorykey = ps.productsubcategorykey
       LEFT JOIN dbo.dimproductcategory AS pc
              ON ps.productcategorykey = pc.productcategorykey
ORDER BY p.productkey ASC
Customer
SELECT [customerkey],
       [geographykey],
       [firstname],
       [lastname],
       firstname + ' ' + lastname AS FullName,
       CASE [gender]
         WHEN 'M' THEN 'Male'
         WHEN 'F' THEN 'Female'
       END                        AS Gender,
       [datefirstpurchase],
       [houseownerflag],
       [numbercarsowned]
FROM   [AdventureWorksDW2019].[dbo].[dimcustomer]
ORDER BY customerkey ASC
Geography
SELECT [geographykey],
       [city],
       [stateprovincecode],
       [stateprovincename],
       [countryregioncode],
       [englishcountryregionname],
       [postalcode],
       g.salesterritorykey,
       s.salesterritoryregion,
       s.salesterritoryregion
FROM   [AdventureWorksDW2019].[dbo].[dimgeography] AS g
       LEFT JOIN dbo.dimsalesterritory AS s
              ON g.salesterritorykey = s.salesterritorykey
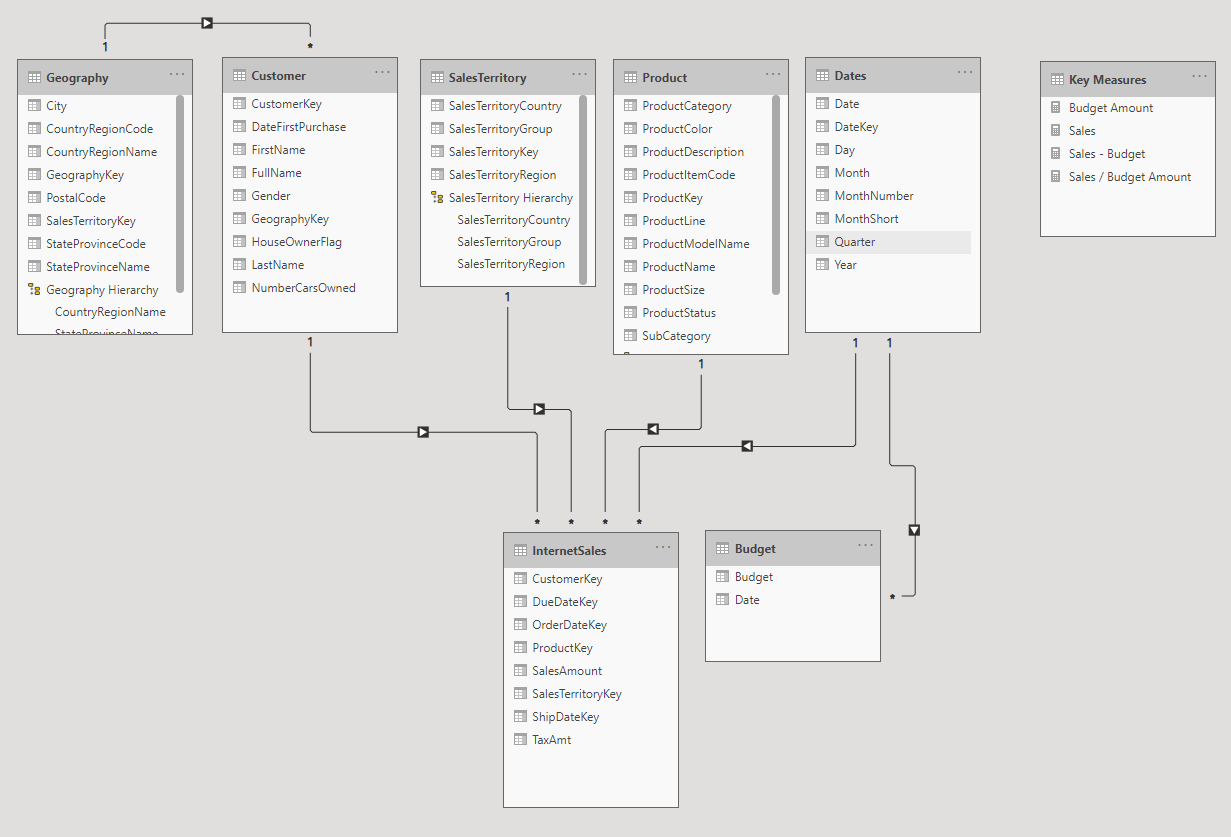
Data Modeling
Below is a image of the data model created in Power BI with the extracted tables from SQL server. Data model follows the Star Schema with Dimension tables on the top pointing to Fact tables on the bottom.
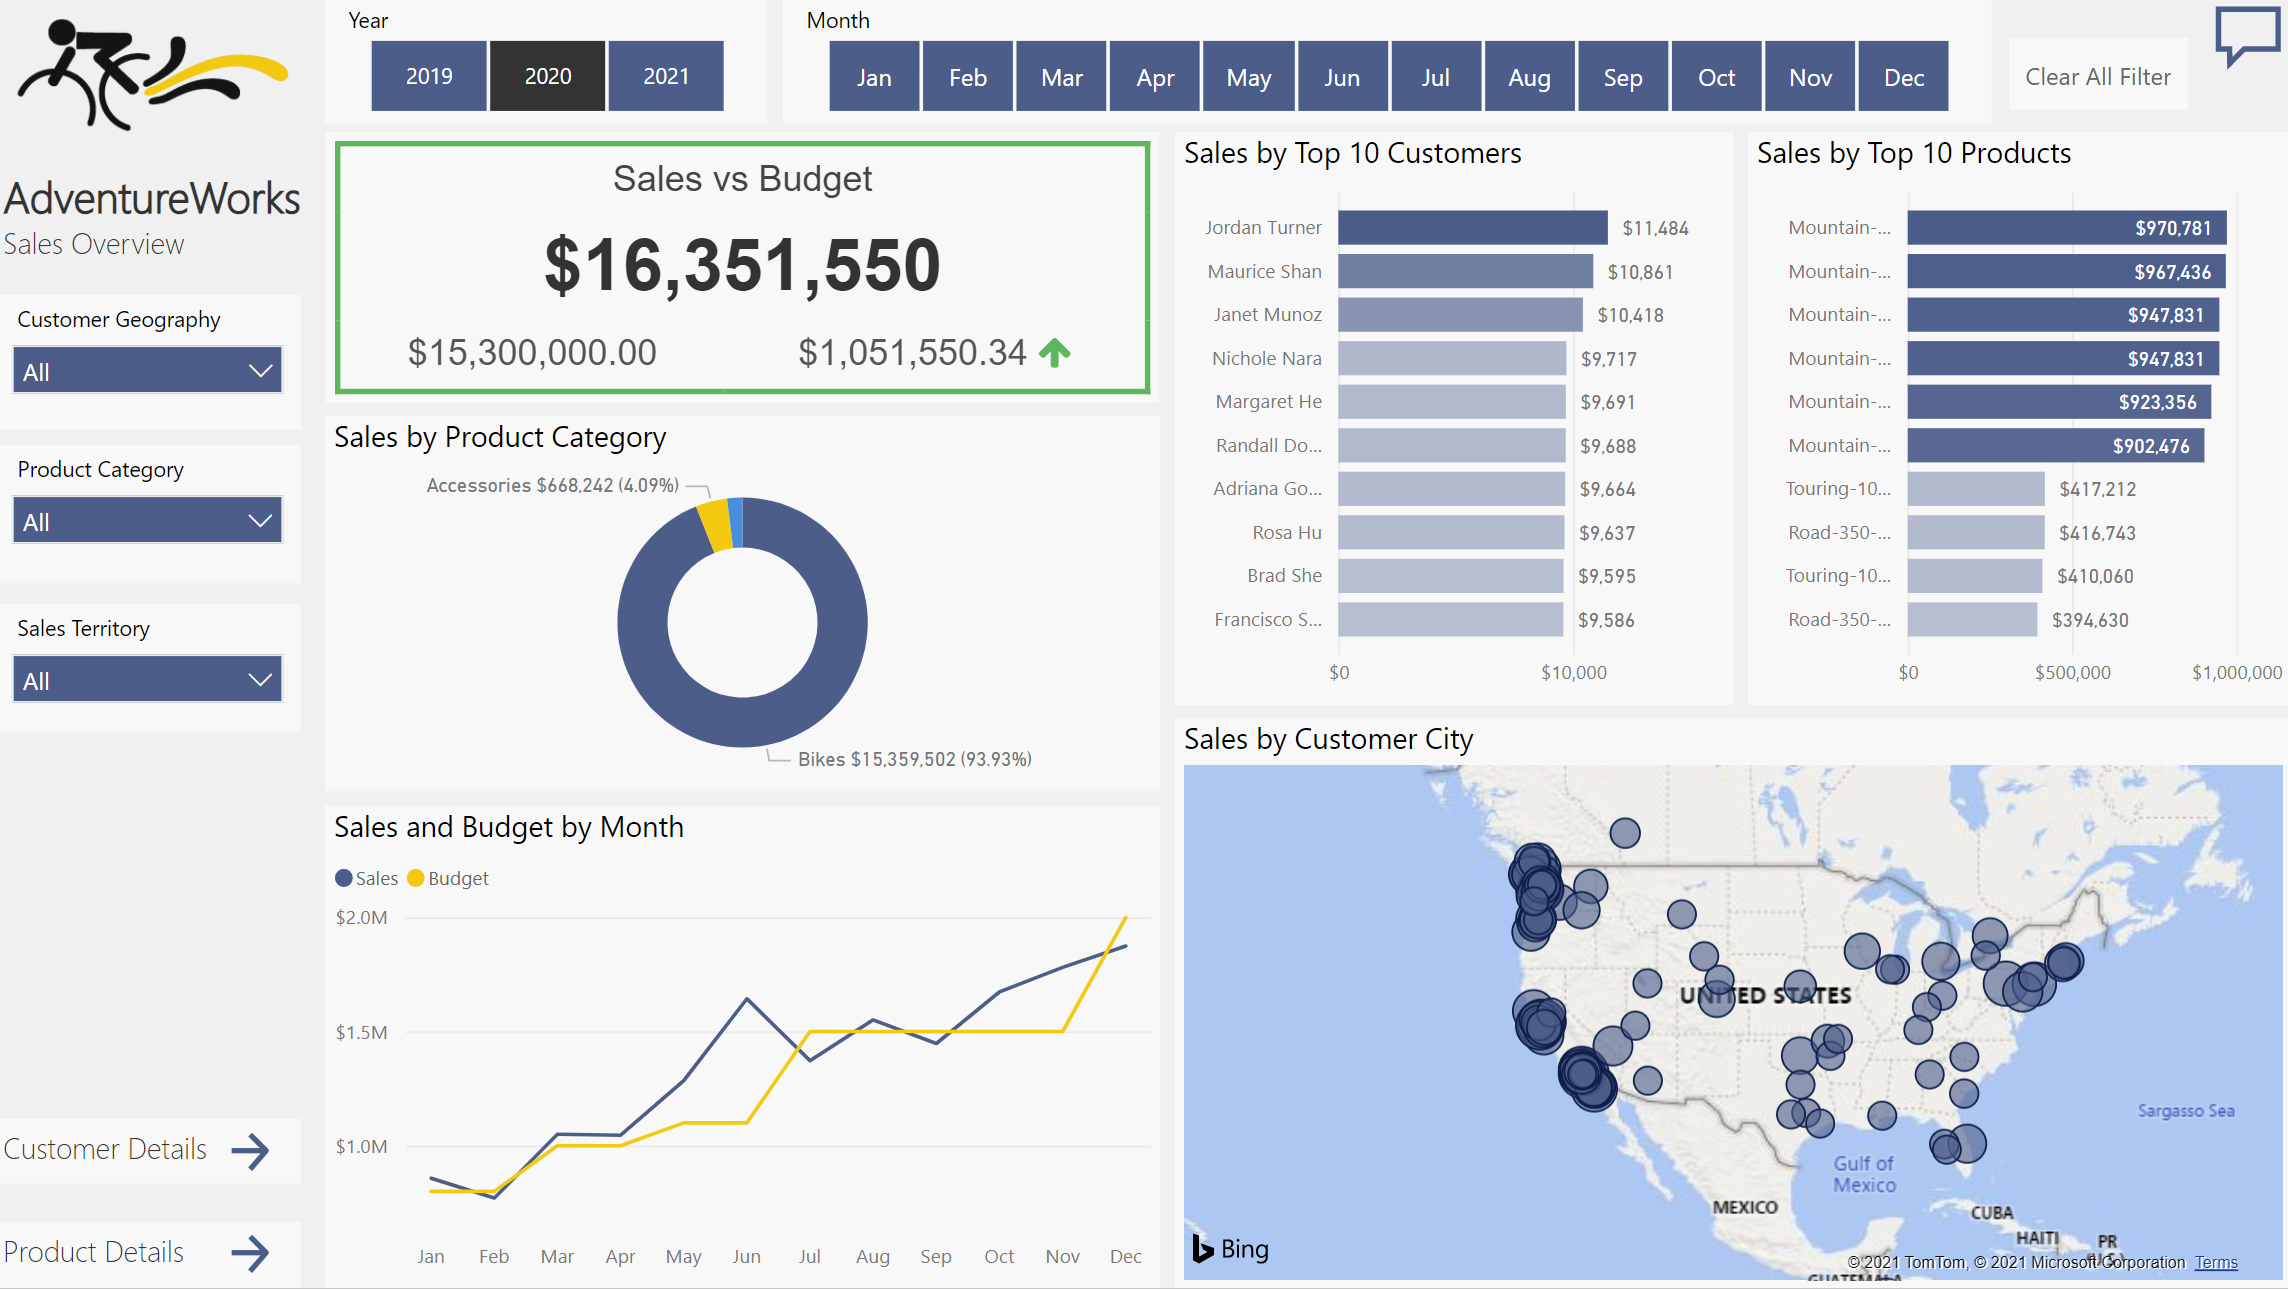
Dashboard
Below is a snapshot of the finished executive sales dashboard, click on the image to be directed to the online dashboard!